| Table of Contents | Chapter 9 |
8
INVESTMENTS
Asset Allocation
George Alden
Meeting an investor’s needs is more than a matter of finding the perfect financial product. The investor’s short-term and long-term financial goals must be identified. Once this is done, the various investments can be analyzed for their risk and return and their impact on the investor’s goals. An increasingly common method for developing an appropriate portfolio is referred to as asset allocation.
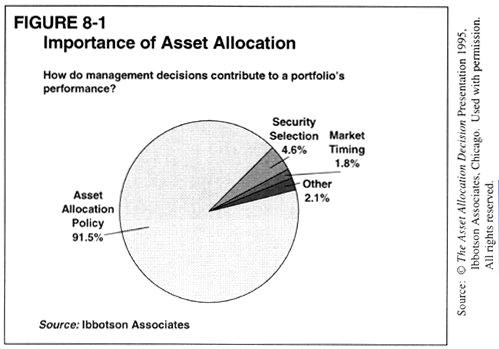
What Is Asset Allocation?
First, let us look at what asset allocation is. Ibbotson Associates defines it in part as "the process of developing a diversified investment portfolio by mixing different assets in varying proportions."1 The mathematical process that calculates this mix was developed by Harry Markowitz in the early 1950s; he was later awarded a share of the 1990 Nobel Prize in Economics for this work. The actual process, called mean-variance optimization (MVO), calculates the security or asset class weights that give a portfolio the maximum expected return for a given level of risk or, conversely, the minimum risk for a given expected return. Although Markowitz first developed his model for individual stocks, the model also has numerous applications to bonds, mutual funds, and other asset classes as historical data have been tracked and measured.
- Ibbotson Associates, The Asset Allocation Decision, presentation materials, Chicago, 1995, p. 58.
Numerous studies have supported the importance of asset allocation. Brinson, Singer, and Barbower’s famous study found that asset allocation accounted for 91.5 percent of the actual return and differences among the returns in the pension funds they studied. Their research also found that market timing adds only 1.8 percent to the true growth of a portfolio. This means that investors should devote the majority of their efforts to formulating an appropriate allocation policy.2
- Ibid., 46.
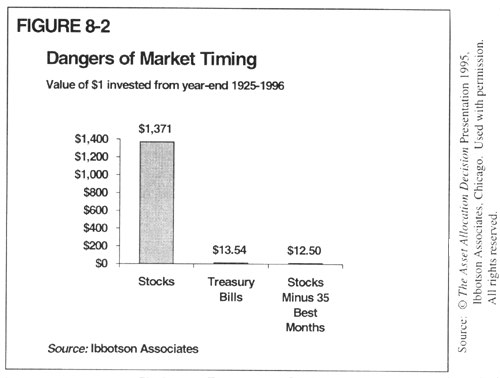
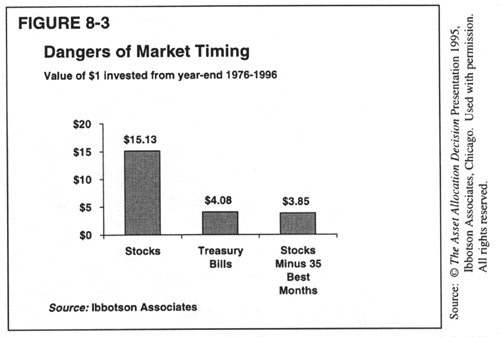
The importance of asset allocation over market timing is further supported by looking at the dangers of market timing. Figures 8-2 and 8-3 illustrate the risks of attempting to time the stock market over the past 69 years and over the immediate 15-year period.3
- Asset Allocation Decision, 29.
The first step in developing an asset allocation policy with a client is making sure that the client has a working knowledge of the different investment alternatives (asset classes), their characteristics, and how they work together. Ibbotson’s presentation material on investment principles and historical asset performance, for example, meets this need and also gives financial services professionals excellent written material to leave with investors.
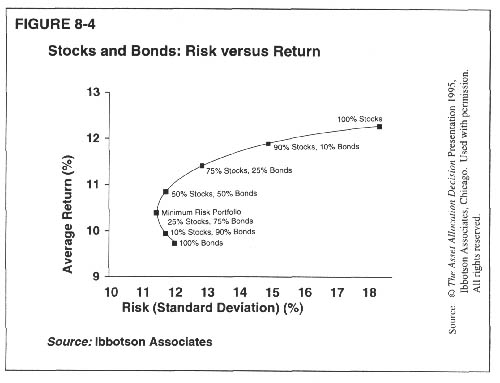
Once this is accomplished, financial advisers can use Ibbotson’s portfolio optimization booklet to review and explain the asset allocation theory and its portfolio optimization software to supplement it. Whatever presentation material and software are used for this purpose, the goal is to further discussion of the client’s given concerns and preferences in developing and selecting investments that can go in his or her model. This culminates with the adviser’s and client’s understanding of the efficient frontier line (see figure 8-44).
- Asset Allocation Decision, 48.
The efficient frontier line was created to represent every possible combination of the two given asset classes: large company stocks and long-term government bonds. Only portfolios that lie on or below the efficient frontier can be constructed. The area above the line represents very high returns at low risk, which are unattainable, given these two asset classes.
It may seem counterintuitive that adding a risky asset—stocks—to an all-bond portfolio decreases a portfolio’s risk, but since stocks and bonds have a low correlation (that is, they tend to move independently of each other), adding stocks to an all-bond portfolio reduces the risk of the portfolio—but only up to a point (the minimum risk portfolio). Adding stocks beyond this point increases both the risk and the expected return of the portfolio.
Portfolios in the upper right-hand corner of the graph are those with the highest returns and risk levels. As one would expect, a portfolio consisting of 100 percent large company stocks provides the highest possible returns as well as the highest risk on this given efficient frontier. An understanding of the model above forms the basis from which to explain how other asset classes can be used in diversifying and designing an even more efficient model.
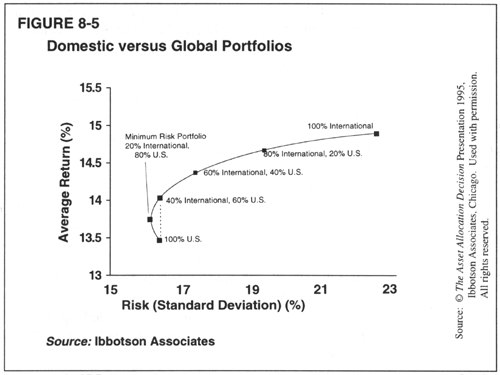
Figure 8-5 shows the benefit of global diversification when comparing the risk and return on a historical basis over the past 20 years.5 Although international stocks have a higher risk than the U.S. stocks, combining the two in a portfolio may actually reduce the portfolio’s risk. This is due to the low correlation of one to another, as explained earlier.6
- Asset Allocation Decision, 45.
- Ibbotson Associates, Global Investing, Presentation booklet, Chicago, 1995.
What Optimization Software Should Be Selected?
Once the the investment professional and investor have a conceptual understanding of asset allocation and how mean-variance optimization models can be utilized to design a portfolio, the next major step is the actual selection of optimization software. Although there are three main players in this area—Ibbotson Associates, Frontier Analytics, and Wilson Associates International—another option is the Custom Asset Management Program (C.A.M.P.), produced by The American College and sold in conjunction with graduate course GS 819 Mutual Funds: Analysis, Allocation, and Performance Evaluation.
The major difference between this software and the others is that C.A.M.P. allows an unlimited number of constraints (limits) that investors can put on their models. It does not rely (unless chosen) on industry benchmarks, market index averages, and peer-group standards. The software requires a proactive role by the investor and adviser to prequalify the actual mutual funds and investments that go into the model. The result is a better informed and educated investor who will typically stay the course and not bail out of the model at the first hint of a down market.
This brings us to our next topic: the definition of the financial adviser’s role.
What Is the Financial Adviser’s Role?
A financial adviser provides many services to his or her client. First, the adviser offers professional advice on the optimal strategic allocation of assets so that the investor can achieve his or her financial objectives. That is, the financial adviser helps to allocate the client’s wealth across familiar and efficient asset classes and products so the client can achieve a specific return, given the client’s risk tolerance, time frame, and tax and liability situation. The strategic allocation decision is based on attaining full diversification for the client and long-term results so that in the long run, the allocation will maximize expected returns subject to the client’s risk tolerance and constraints.7
- Mutual Funds: Analysis, Allocation, and Performance Analysis, The American College, 1995, p. 9.
Since research suggests that on average tactical (short-run) deviations do not result in enhanced returns, the adviser should minimize short-term risk only through dollar-cost-averaging techniques and timing a trade or reallocation to the next or lower tax year to defer or minimize taxes.8 Another added value is the coordination and timing of investments to minimize transaction costs and investor’s fees.
- Ibid.
What Is the Implementation Process in Building the Model?
First, we must set investor parameters. In this example, we will limit the investments in our model to mutual funds and like investments where money managers/investments have a track record.
The first step in the process is to break down the mutual fund universe into manageable sectors* in which we can analyze and compare the actual performance of each fund and money manager to its own peer group or industry averages. To quote Peter Lynch, "As long as you are picking a fund, you might as well pick a good one." This type of analysis can be done by many of the mutual fund database providers—for example, Datamax. Datamax allows the financial adviser to break the mutual fund universe into 11 equity sectors, 9 bond sectors, and 3 money market sectors.
*Editor's Note: Mutual Fund Sectors/Top Mutual Funds:
- Stock Funds: Aggressive Growth, Long-Term Growth, Growth & Income, Income, Total Return Funds, Gold & Precious Metals, Balanced (part Equity, part Bonds), Foreign Equity, and Foreign/U.S. Equity
- Bond funds (in addition to Balanced, listed above): High-Yield Corporate Bond, High-Quality Corporate Bond, Foreign/U.S. Bond, Government Securities, Ginnie Mae, High-Quality Muni Bond, High-Yield Muni Bond, and Single State Muni Bond
- Cash funds: Money-Market Taxable, Money-Market Tax-Free, and Money-Market Government Securities.
For a detailed chart of these bonds and their allocations, please consult the book Financial Planning 2000, available from The American College.Datamax then enables the adviser to analyze a given fund to a sector or industry benchmark over various time frames. For the purpose of strategic allocation, we use the most recent 5-year returns to identify the best performers and money managers, taking note of any recent management changes. This is not to say that funds that have been in existence for fewer than 5 years are not in our model. With the high turnover of money managers, we can actually look at historical track records and arrive at a conclusion based on their abilities. Historical data can also be extrapolated to fill in benchmarks for these new funds to provide comparable—but not exact—standard deviation calculations.
The next step is to select a core of mutual fund families (normally six) that continually outperform their peers’ returns on both a gross and net basis in fees, loads, and expenses. This also has some practical merit in that reallocating within a few given families keeps transaction costs to a minimum. Since front-end loads, no loads, contingent deferred sales charges, and investment breakpoints can dramatically reduce a fund’s return, advisers and investors must take this practical step when building a model portfolio.
Another consideration in the selection process of a specific mutual fund family is the investor’s actual investment selections in his or her 401(k) or retirement plan. In most cases, the financial adviser is able to find and account for these mutual funds in the overall management of the portfolio. The adviser can then efficiently constrain a certain amount of dollars to these funds and efficiently manage and account for these dollars. In a lot of cases, this is a major portion of the client’s portfolio, and financial advisers would be remiss if they did not correctly allocate and account for these dollars.
The next consideration is to ensure that at least one of the families offers some indexed funds as an option. The adviser’s position is to provide a given return with the least risk, taking the client’s specific needs, risk, and other requirements into consideration. It is not the adviser’s decision to select actively or passively managed funds. Both types of funds are compelling and have their own merits. Excluding one or the other would be a mistake.
The final step is to select at least one top mutual fund family that offers its funds and money managers through a variable annuity and a variable universal life (VUL) product. This would obviously add value and real return to a portfolio if all taxes were deferred. Another requirement is a fixed rate or guaranteed option. Because the risk (standard deviation) of a fixed-rate annuity or VUL is usually very low, including one in a portfolio has brought down many complete portfolios’ standard deviation by 20 to 30 percent. Another added value of annuities and life insurance is that they are creditor and bankruptcy proof in some states—Texas, for example. That alone could sway an investor to use them, not to mention covering the typical mortality fee of 20 to 30 points that a mutual fund does not have.
Based on finding (1) the top mutual funds in our 20 fund sectors, (2) a crossover fund for variable annuities, and (3) a variable universal life product, we have identified the following mutual fund families:*
*Editor's Note: For more detail on the asset allocation of these and other top mutual funds, please consult the book Financial Planning 2000, available from The American College.
The Mainstay Family of Funds—the proprietary mutual funds of NYLIFE Securities (New York Life)—gives us the crossover to a variable annuity and variable universal life product with a guaranteed rate/fixed-rate option, and an S&P 500 index option.
How Are Individual Mutual Funds Selected?
To narrow down our investment selection process the next step is to come up with, in essence, a dream team or all-star performers from the six fund families, spanning the 20 investment sectors.
This can be accomplished quantitatively, subjectively, or both. Some financial advisers prefer to use both, but in a given order with different objectives in mind. The following summarizes the five-step process:
Step 1: Analyze each sector on a 5-, 3-, and one-year basis net of all fees and expenses. This simply identifies the best-performing funds for each sector and time frame.
Step 2: Look for upward or downward trends in the performance of the fund.
Step 3: Identify any management changes or concerns.
Step 4: Cross-reference the findings with Morningstar (another software package, which gives a subjective opinion on each of the funds and reports how each fund did in its sector analysis along with the many standard modern portfolio theory components: alpha, beta, sharpe,and so on9).
- Morningstar, Inc., "Mutual Funds."
Step 5: Select the top four to eight funds per sector, depending on the number available in each sector and actual return differences.
How Is the Asset Allocation Software Implemented?
The following are the steps involved in an unconstrained allocation:*
*Editor's note: Definition of "Unconstrained Allocation": Where there are no Client-Specified Constraints, limits, or minimum allocations imposed on the solution of achieving a target return with minimum risk given a set of investments (mutual funds). Definition of "Constrained Allocation": Where the Client-Specified Constraints, limits, and minimum allocations are imposed on the solution of achieving a target return with minimum risk given a set of investments (mutual funds).
Step 1: Load the historical returns of the 59 funds on a quarterly basis—maximum of 60 quarters (15 years)—into the model. In our example, the returns loaded are from Morningstar and its database. Gross returns are loaded for all funds (due to separate classes of funds, A, B, C, and all of the various combination of fees, loads, and expenses). Note that the gross and net returns of a lot of these funds are the same because of their fund classes and their specific reporting procedures.
Step 2: Calculate what the gross returns of all tax-free municipal bonds would be (using 28 percent or the appropriate tax bracket). This allows the model to evaluate and calculate all numbers on an equal basis.
Step 3: Run an unconstrained model of the above 59 funds with their actual return capabilities.
Step 4: Review the correlation matrix of funds to ensure polarization of given funds. It may be necessary to revisit the 20 sectors at this point to obtain adequate diversification.
The steps for a constrained allocation are as follows:
Step 1: Determine what internal and external constraints are needed for the model, using the following checklist:
Internal Constraints (Limits or Caps Set by Investor or Adviser)
- Individual fund limits: % or $ of portfolio minimum/maximum
- Sector fund limits: % or $ of stocks/bonds/international stocks and bonds minimum/maximum
- Fund family: % or $ minimum or maximum and/or retirement plan investments (401(k) choices) % or $
- Variable annuity: Investment choices
- Variable universal life: Investment choices
- External Constraints (Limits or Caps Set by Outside Source)
Fund family: Retirement plan investments (401(k) choices)
% or $Variable annuity: Investment choices
Variable universal life: Investment choices
Taxation: Regular/capital gains/tax deferred
Transaction costs: Front-end loads, fees, contingent deferred sales charges
Market condition: Current trend
Interest rates: Current trend
Step 2: Run the constrained model within the return capabilities. If the model cannot solve for a given return, the financial adviser will be forced to amend constraints and rerun the model until there are acceptable results for each given return.
Examples of these procedures are included at the end of this article. Also included is an example of a 401(k) plan with an efficient frontier calculated for its investment choices.*
*Editor's Note: Please consult the book Financial Planning 2000 for the detailed charts referenced in these paragraphs
What Are Some Practical Issues and Concerns in the Initial Allocation and Reallocation Process?
The initial allocation and the reallocation process of the given portfolio are very similar but are separate events. In fact, the recommendation to sell old and familiar investments in order to buy unfamiliar investments will generate client anxiety even though the changes may substantially improve the risk/return characteristic of the portfolio.10
- Roger C. Gibson. Asset Allocation: Balancing Financial Risk, Irwin Professional Publishing, 1990, p. 243.
There is a tendency for clients to view appreciated assets as bargains, because they think of them in terms of their low purchase prices. Of course, the historical cost has nothing to do with whether the stock will continue to perform based on its current market value and potential.11
- Ibid.
The tax issues involved with the sale of an appreciated investment can often complicate the decision. Unless held to death, the income tax due on the gain of the asset will have to be paid sooner or later. For income tax purposes, the event should be timed, if possible, so tha it occurs in the first quarter of the next year if the end of the calendar year is approaching.12
- Ibid., 244.
Another complicating factor occurs when a highly appreciated asset has a good income yield. Although the government has a claim on the unrealized appreciation, the client nevertheless gets the entire income stream from the investment. Consider a stock or bond with a $10 per share tax basis that is now selling for $60 per share. If it currently pays $3.60 per year in dividends, its current income yield is 6 percent. Assume that upon the sale, 30 percent of the realized gain will be lost to income taxes. This leaves an after-tax proceeds of $45 available for repositioning. To generate the same $3.60 per share in income means finding a stock or bond with an 8 percent yield ($45.00 x 0.08 = $3.60). Clearly, this is a factor that must be carefully weighed in the retention/disposition decision.13
- Ibid., 245.
A client’s age and health also need to be considered. The current tax code provides for a stepped-up tax basis for appreciated assets upon the investor’s death. Retaining these assets would be the obvious decision for a terminally ill client.14
- Ibid.
Another potential problem arises when an investment could be sold that has an unusually large unrealized capital loss. The client may have to overcome the psychological problem—the paper loss syndrome—of feeling that no money is lost unless the position is sold. The investor and the adviser should make lemonade out of this sour event by checking with the investor’s CPA to ensure that the investor enjoys the maximum tax benefits.15
- Ibid., 246.
To head off a lot of these problems the adviser and investor could hypothetically convert the client’s entire portfolio to cash and base the analysis and returns on those numbers. The real question to the client would then be, would you buy the investment again?16
- Gibson. Asset Allocation, 247.
After all is said and done, if the investor mandates that a specific investment not be sold, the financial adviser is left with two options:
Common sense is paramount. To implement the allocation process the adviser should use a dollar-cost-averaging technique over a 3- to 6-month period, giving consideration to all of the points above.
Reallocation Process (Rebalancing). The decision process for reallocating or rebalancing the model is basically the same as the initial process—but in reverse order. When a given fund is outside its accepted percentage—that is, ± 5 percent—the rebalancing issue should be addressed.17 An investment that is performing outside the ± 5 percent range usually signals to clients and qualified plan sponsors that reallocation should be considered.
- Jess Lederman and Robert A. Klein. Global Asset Allocation Techniques for Optimizing Portfolio Management, John Wiley and Sons, Inc., p. 57
These round percentage numbers have an inherent simplicity and beauty. Clients, trustees, and fiduciaries understand percentages much more easily than standard deviations, variances, geometric means, and other statistical terms.18
- Ibid., 57.
Are there other techniques available to manage the asset allocation structure more efficiently? Studies by industry leaders Perold and Sharpe evaluated several rebalancing strategies for their potential payoff under different market conditions, including the buy-and-hold approach and the constant-proportion strategy. Their findings can be summarized as follows:
- A buy-and-hold approach is a completely passive strategy; no rebalancing of the portfolio occurs. In a constantly declining or rising market, this strategy will outperform a constant-mix strategy.19
- A constant-mix strategy keeps the exposure to each asset class at a constant proportion of the total portfolio. This is an active process that usually requires
- the purchase of an asset class as it drops in relative value
- the sale of an asset class as it rises in relative value
- Ibid.
These adjustments are usually guided by a decision rule (for example, ± 5 percent) that triggers the point at which to take the rebalancing action. The constant-mix strategy tends to outperform the buy-and-hold process in markets that oscillate and show some volatility but do not exhibit a major sustained movement in any one direction.20
- Lederman and Klein. Global Asset Allocation Techniques, 57.
The key point that Perold and Sharpe made was that no one type of rebalancing strategy is the best for all investors because the asset allocation decision (model) itself attempts to optimize return relative to risk (volatility). The result is that each investor brings to the reallocation process a different degree of fit and constraints between the investor’s risk tolerance and the rebalancing strategy’s payoff potential in different type of markets. Therefore the selection of an appropriate rebalancing strategy requires a clear understanding of who will enjoy the reward of return and who will bear the risk associated with not achieving that return. That brings us full circle to our original defined-return (defined-benefit) approach to achieve a specific benefit for our client.21
- Ibid.
One last finding concerning portfolio rebalancing: Mark A. Hurrell, who evaluated various calendar period and percentage-of-portfolio rebalancing thresholds, indicates that of the calendar-based methods, quarterly rebalancing produces the best results. This study also suggests that the ideal range for percentage-of-portfolio variance bands ranges from ± 5 percent to ± 9 percent. This range, however, outperformed the annual rebalancing only by one-quarter of one percent (10 basis points). Investors should weigh that extra edge in return to the actual transaction costs and tax ramifications of making frequent changes on a quarterly basis.22
- Mark A. Hurrell. "Measuring Up," Yannie Bilkey Investment Consulting, 1991.
The obvious and final role of the adviser in the reallocation, rebalancing, and maintenance process is to maintain a steady vigil on the performance of the actual funds and asset classes themselves. He or she should make appropriate additions and subtractions of funds to or from the asset classes and thus help the client not only to reach his or her financial goal but also to maintain it over time.
Where Can I Find out More?
Revised Stock Market Circuit Breakers
William J. Ruckstuhl
What Was the Situation Before?
As a consequence of the sharp drop in the Dow Jones Industrial Average (and all other market indices) in October 1987, a system of trading halts, known as circuit breakers, was established and specified in terms of changes in the Dow Jones Industrial Average (DJIA).
The need for some moments of pause in trading was a consequence of changes that had occurred in the securities markets. Institutions then, as now, were a major factor in determining the number of transactions and shares traded, amounting to almost 90 percent of the daily trading activity. With the increase in performance bonuses, computer-driven trading decisions, and the use of competing money managers for segments of portfolios, conventional wisdom determined that some changes were needed after the October 1987 decline. These changes were as follows:
What Has Been Occurring?The DJIA has reached heights that most investors never thought would be seen in their lifetime. Today (February 14, 1997) the DJIA exceeds 7000, a more-than-threefold increase since the installation of the trading halts.
Due to this increase, these trading collars could be implemented for relatively small percentage changes. For example, the 250-point change for a 30-minute trading halt now represents a 3.5 percent change in the DJIA and the 400-point change a 5.7 percent decline. The intent was that these trading collars would take effect for drops in the DJIA that are really significant. Are these percentage changes significant? The SEC thought not.
What Is the Situation Now?
The limits for the trading collars have been increased to 350 for the half-hour trading halt and 550 for the hour halt. Even so, the percentage declines are 5 percent for the half-hour and 7.85 for the hour halt when the Dow is 7000. (Note: The trigger points for other measures have also been changed in line with the adjustments for the DJIA triggers.)
No change was made in the 50-point rise or fall limit for computer-generated trading collars despite their being triggered 24 times during the first 4 trading weeks of 1997.
Analysis
Only once since the original trading collars were put in place did the DJIA almost fall by 250 points (March 1996). Although the limit now is 350 points or 5 percent, a change of this magnitude could occur. More important than the 5 percent drop is the psychological effect of the market "shutting down" for 30 minutes. How would investors, money managers, 401(k) participants, and computer trading react to such a condition? This is an unknown and a prognostication would only be conjecture.
A Sample Prognostication. What would happen if a 30-minute halt in security trading, due to the sharp decline in prices, were to occur on the exchanges? Conventional wisdom holds that the stock market overreacts to both good and bad news. If so, then there is hope that less emotional, more rational decisions would be made and the market would reverse its downward movement. What actually occurs will be influenced by the precipitating cause of the halt. The answer to the question "What happened to change the expectations of stock market participants?" would profoundly influence how decision makers, professional money managers, and individuals react to the trading halt.
For example, from Friday, February 28, to Tuesday, March 4, 1997 (3 trading days), the market fell almost 200 points as a consequence of some relatively mild statements by the chairperson of the Federal Reserve (at least, so conventional wisdom explains this decline). Had the statements been stronger and been followed with actions that would lead to reducing the availability of credit and its consequential increase in interest rates, then the market could have declined by more than 350 points (less than a 4 percent decline). In this scenario, uncertainty as to the magnitude of the monetary policy change could indeed lead to a continued increase in selling pressures as investors sought to protect themselves from the interest rate risk and its consequences. Thus stock prices would continue their downward spiral and perhaps trigger the one-hour trading halt. If by good fortune this second halt started slightly less than one hour prior to the close of trading, investors would have time to assess the change prior to the market opening the next trading day. Coupling the Federal Reserve’s actions with more financial information could lead to different trading behaviors. If expectations suggested that any change in interest rates would be insignificant and after-trading news provided favorable earnings and other corporate information, the market could largely ignore the Federal Reserve’s comments and monetary changes. Should the opposite be the case (sharp interest rate increase and disappointing corporate profits), the market conditions could worsen.
Suppose for a moment that the cause of the decline was the President’s heart attack (as occurred when Eisenhower was President) or the start of a war that impeded the flow of petroleum. Then the market could easily fall the 350 points, but when trading resumed, the overreaction might be reversed.
Conjecture of the above ilk is purely that, conjecture. Who can write today what will be the force that drives the market down sufficiently to have a trading halt implemented? The big drop in October 1987 was not immediately preceded by an earth-shattering event. The decline had started in August, and something happened between Friday and Monday in October that changed investor expectations. Certainly both trading halts would have occurred. The next day several stocks did not open for some time, and many investors continued to contact their brokers to unload their holdings. By the end of the week, some semblance of order was achieved. But one must wonder about investor reaction if a halt was imposed for the very first time.
Many variables have changed since October 1987. One such change is the greater use of defined-contribution pension plans where the investment decisions (timing and the investment security) are made by plan participants (self-directed plans). Participants have been advised for years that equities are the long-term instrument to beat inflation. Should participants elect to remain with their equity holdings, then the market could possibly avoid the kind of fall that is feared after a halt.
A second favorable change is that recently more money is being invested in mutual funds than in guaranteed investment contracts—again, a potential stabilizer.
One facet of this is certain. The 6-year bull market eventually will end, hopefully with a whimper.
Where Can I Find Out More?
New Twists on Corporate Dividend Reinvestment Plans (DRIPs)
William J. Ruckstuhl
What Was the Situation Before?
During the past 10 or more years, many publicly traded corporations have installed DRIPs. In these plans, dividends declared are used by some investors to acquire additional shares in a manner similar to the reinvestment of dividends in mutual funds. For the corporation, these plans are a way of (1) raising capital by selling newly issued or treasury stock shares, (2) supporting the market price by having the plan purchase shares on behalf of investors, and (3) increasing the number of shares held by investors who are favorably disposed to the corporation in case of an unfriendly tender offer. Currently more than 825 publicly traded corporations offer such plans.
Although variations exist among these firms, all require either a partial or full reinvestment of declared cash dividends. Other features of these plans, though not necessarily found in each and every DRIP, provide the investor with the following opportunities:
What Is the Nature of the Changes?
Recently the IRS has permitted participating corporations to modify their plans and allow investors to do the following:
Why Were the Changes Made?
Several reasons can be advanced for these changes. The first is that several years ago the SEC reduced the time that investors have to settle with their broker for any transactions from 5 days to 3 days. Concurrent with this change, the brokerage firms heavily advocated leaving shares in "street name" for the convenience of both the investor’s trading activities and dividend and tax record keeping. When shares are held in street name, the issuing corporation is handicapped in attempting to communicate with its shareholders and must rely on the brokerage firms to notify the issuer as to how many street-name shareholders they have and then to forward the issuer’s quarterly and annual reports as well as other communications to the shareholders. This is a time-consuming process, and not all street-name shareholders receive this information flow that the issuing corporations and their shareholder relations departments view as desirable.
A second reason is cost to the investor. As more and more brokerage firms impose annual account fees and specific charges if the investor desires to receive the shares in certificate form, the issuing corporations have pointed out that these investment costs can be reduced by using their plans.
A third reason, only obliquely mentioned, is the advantage that a DRIP participant has for easily changing the brokerage firm with whom he or she has a relationship. This is accomplished by opening an account elsewhere and trading through that firm. Although brokerage firms can sell one’s street-name or delivered stock the same day, it seems to take 4 to 6 weeks for street-name shares to be transferred to another broker (or delivered to the customer in certificate form).
How Can Financial Planners Use These Changes?
For fee-only planners, the changes provide a means of recommending investments that do not add to the client’s total cost. For fee-with-commission-offset planners, they provide a means by which the planner can retain a larger percentage of the annual fee.
Of course, these plans should be recommended only when they are in the best interests of the client. Holding only one stock loses any benefits of diversification. However, if an investor currently possesses a diversified portfolio, these plans can add some additional diversification with little or no cost.
Are There Any Drawbacks?
Certainly. The first is that the firms providing DRIPs or these new variations tend to be concentrated in the noncyclical consumer goods, utility, service, and financial industries. A diversified portfolio could be difficult to construct given the limited number of firms and industries offering these plans.
In addition, being larger than nonproviders of these plans, these firms tend to have lower projected growth rates, P/Es, sales, and book values. But they do tend to have significantly higher market prices and dividend yields.
Where Can I Find Out More?
Financial Planning 2000—What Will It Be Like?
William J. Ruckstuhl
What Is the Current Situation?
The DJIA exceeds 7000 and other indexes of the United States stock market performance are nearing or passing all-time highs. Consumers are optimistic about their future income as their use of consumer credit has risen sharply and retail sales reflect this spending. Economists, the practitioners of the dismal science, generally agree that inflation is under control (and probably has been overstated for years), the American economy’s health is good, interest rates are within due bounds, and the recovery has at least 2 more years to run.
Having been around for threescore and seven years, I find my skepticism arises when the consensus has few if any dissenters. But let us remember the words of the eminent economist, Irving Fisher, who stated in early 1929 that "the economy is reaching a new level of prosperity." Indeed it did! Unfortunately within a few years it did again, but at a much reduced level than had been attained in 1929.
What Were the Conditions in 1997 and 1998?
The economy moved along, boosted by rising stock markets and benign Federal Reserve actions leading to a period of relatively stable interest rates. Corporate profits rose, wealthy taxpayers and homeowners obtained capital-gains tax relief, transfer taxes (inheritance and gift) were largely eliminated, and the balanced budget amendment including social security expenditures and unemployment compensation payments was passed and sent to the states for ratification. Employment remained at high levels, lowered CPI inflation reduced government expenditures and raised revenues since inflation-indexing of tax rates lessened. Life was good.
What Happened in 1999?
Following the Republican landslide in the 1998 elections that resulted in control of state legislatures, the balanced budget amendment rapidly received the approval of 38 states.
Small engagements over turf on distant continents had few worldwide economic spin-offs. There was widespread concern with the rising use of the petroleum reserves due to the prosperity of the world’s nations, and energy prices started to inch upward. Simultaneous eruptions of dormant volcanoes in the North American and the South Pacific regions spewed voluminous amounts of dust, ash, and other impurities into the air, with the result that Earth’s climate underwent a significant change. Less sunlight reached agricultural areas, the incidence of respiratory illnesses decimated world labor force participation rates, speculators acquired futures on every agricultural commodity, and then crops failed.
The resulting panic to stock the larder and freezers swelled consumer demand for food products and the prices of these goods responded as economists would predict. Available spending for other consumer nondurables, durables, and services sharply declined, resulting in widespread curtailment of production and rapid upward movement in the new claims for unemployment compensation.
Consumers, acting in their self-interest, curtailed spending beyond the price effect of food on their budgets, and savings rates rose beyond prior historical levels, further worsening the production and unemployment statistics. Private sector capital expenditures, except for the massive unplanned inventory buildups, virtually ceased worldwide. Government revenues plummeted, leading to massive reductions in spending to maintain the balanced budget.
The DJIA fell 4,000 points, and other broad-based indexes experienced equal relative declines. Small stock indexes lost almost 85 percent of their value. The Federal Reserve sought to stimulate investment by lowering interest rates to 1 and 2 percent to help the budget deficit by making short-term borrowing less expensive. Unfortunately, individuals and institutions wanted whatever could be salvaged from their debt instruments. EE bond redemptions soared, rollovers of T-bills became nonexistent, and refunding issues failed to sell. Corporations faced the same results. Money and capital debt markets collapsed. Confidence in the financial community disappeared as life insurance cash values and bank account balances were converted to currency.
World opinion created an unpleasant environment for petty dictators and emotional factions that endangered world peace and human rights during the early 1990s. Additional petroleum reserves were located and alternative fuels showed the promise of economic feasibility, leading to sustained economic growth. Technological advances in agriculture and animal cloning produced bumper harvests. Food prices fell and consumers used these cost reductions to acquire more of the toys of the adult. Medical advances stopped the main killers dead in their tracks, and life expectancies increased by a decade or more.
Rising prosperity increased government receipts, resulting in significant reductions in the magnitude of the government debt. Freed accumulated savings sought other investment opportunities. As a consequence, interest rates fell sharply and the DJIA soared past 15,000. Other indexes did likewise. Dividend yield plummeted.
Prices, except for food, began a steep climb. The Federal Reserve was unable to pursue effective monetary restraint to stem this inflationary effect due to the huge government surplus and private sector saving. Bank interest paid on savings neared the rates that existed prior to the Accord of 1951. Congress was stymied, uncertain whether to raise taxes (more government saving that would drive interest rates down) or cut taxes (more consumer spending that would increase the rate of inflation).
Low interest rates in the United States precipitated large flights of capital to other parts of the world, thus having the effect of reducing interest rates across the industrial nations. World investment and then consumption expenditures rose, and inflation rates increased dramatically. Seeking to halt the upward price spiral, economic policy of most countries resulted in rapid increases in unemployment rivaling those of the 1930s. International trade ground to a halt except for needed raw materials. Tariffs on manufactured goods skyrocketed due to the collapse of GATT.
The economy maintained its upward growth in employment and output while inflation remained at mid-1990s rates. The Federal Reserve was able, by jawboning, to contain some of the exuberance that drove the DJIA from 4000 in February 1995 to 7000 in February 1997 and to 8000 in late 1998. P/E ratios and dividend yields returned to more traditional levels as corporate profits and dividends increased as a result of the widespread prosperity. Modest increases in stock indexes were the rule. Partial relief on capital-gains taxation created many of the benefits stressed by its advocates.
The welfare program changes enacted in 1996 and 1997 reduced government spending to the point where, with increased tax revenues, draconian spending reductions were avoided and slight inroads were made on the magnitude of the federal debt. Confidence in government emerged as the citizenry realized that action could be taken if an economic collapse occurred, and the balanced budget amendment, although approved by 26 states, disappeared as a political issue as rapidly as did the Know-Nothing Party of the mid-1800s.
Worldwide events stabilized. Minor wars flourished, however, providing markets for defense contractors, although none of these excursions spread beyond small regions of Asia or Africa. Alternative fuels for petroleum began to be commercially viable, and world petroleum reserves increased because of successful exploration in previously undeveloped petroleum-producing areas. Weather conditions remained favorable for agricultural products, and technological advances from the American agricultural colleges continued to raise crop yields.
Economists, politicians, and businesspersons agreed that a continuation of the 1990s expansion would be the most likely scenario for the foreseeable future. Not only will the year 2000 be a numerical millennium, but it is being touted as the start of an economic millennium that should carry the United States and the world economies through an extended period of prosperity.
How Does the Financial Planner Advise Clients in the Year 2000?
For scenario one: Advise clients to buy gold, dig a bomb shelter, and shoot to kill. (Also open a direct hotline to Dr. Kevorkian.)
For scenario two: Advise clients to buy gold and escape to the north woods until the shakeout is over.
For scenario three: Advise clients to hire their own economist—they obviously bring good luck.
What Is the Benefit of These Scenarios to the Planner?
Economic and political events, coupled with human behavior, oft sink the plans of mice and humans. Planners must realize that changes will occur and that long-range planning faces undreamed-of uncertainties. For financial planning 2000, who knows? Unless you have a better crystal ball than the author, pick your scenario for the latter part of 1999 and then devise the appropriate strategies for your clients. Remember that you must also explain what happened in 1997 and 1998!
Mutual Fund Capital Gains—A Conduit Is Not Always a Conduit
William J. Ruckstuhl
In many applications associated with financial affairs, devices provide a conduit so that funds received hold their characteristics when flowing to the residual owners. And we think that mutual funds also have this characteristic since municipal bond interest flows to shareholders as tax-exempt income for federal tax purposes. U.S. Treasury flows are, for fund shareholders, exempt from state income taxation, and long-term capital gains retain this characteristic when passed to shareholders.
Where Does the Conduit Concept Not Apply?
Short-term capital-gains realized by mutual funds, unlike long-term capital gains, are not passed through as such. Rather they are used in a manner not consistent with the conduit concept. IRS regulations state that the long-term capital gain of the fund is determined by subtracting any realized short-term capital losses from the realized long-term gains. This becomes the amount of long-term capital gain that is distributable by the fund.
When Do These Tax Effects Work to the Disadvantage of the Fund Shareholder?
This procedure results in the fund performing the equivalent of the 1040 schedule D calculation for the shareholder before making its distribution for tax purposes. When the net long-term capital gain exceeds the net short-term capital loss, the shareholder becomes indifferent to methodology, since the net result is a long-term capital gain.
In another scenario, suppose the fund realizes only short-term capital gains during its year. These gains flow to the shareholder as ordinary dividends and are subject to the shareholder’s marginal income tax bracket. In this instance, the shareholder/taxpayer is unable to use these short-term gains to offset his or her other portfolio short- or long-term capital losses.
Example: J. Investor’s mutual fund had, for his ownership interest, $1,000 of short-term gains for the year. For the same year he realized $5,000 of long-term capital loss from his non-mutual fund investments. Had the short-term gains flowed through to him, he would have been able to reduce his taxable income by $4,000 of the long-term capital loss ($1,000 offset by the fund’s short-term gains and the maximum $3,000 long-term capital gain [loss] deduction for any one year). Instead, he has a $1,000 higher ordinary income since the short-term gain from the fund was reported as a dividend, and he is able to deduct only $3,000 of the loss. Investor has a higher taxable income by $1,000, so in addition to paying income taxes on that sum in his highest tax bracket, it is also possible that, because of the higher income, he could lose some of his itemized deductions and personal exemptions and be subject to additional income taxes.
If the fund’s short-term capital gains exceed its long-term losses, the same result occurs, to the detriment of the fund’s shareholder.
Example: S. Investor’s mutual fund had, for her ownership interest, $2,000 of short-term capital gains and $1,000 of long-term capital losses. For the same year she realized $7,000 of capital losses (either short- or long-term) from her non-mutual fund investments. Had the net short-term capital gain of the fund flowed as such, she would have been able to use it to offset some of her non-mutual fund capital losses, thereby reducing her total income tax (as well as possibly avoiding loss of some of the standard deductions and personal exemptions).
In these situations, the shareholder loses as a consequence of the manner prescribed by the IRS.
How Can the Investor Manage These Differences?
Certain types of mutual funds are more likely to have the majority of their capital gains in the form of long-term rather than short-term. Examples of these are the following:
Where can I find out more?
- IRC Sec. 852.
- Reg. Sec. 1.852-1 to 1.852-3.
Emergency Cash—Investment Alternatives
Thomas A. Dziadosz
Advice differs on how much clients should keep in emergency cash reserves and where the funds should be invested. Conventional wisdom holds that an emergency fund should be invested in cash instruments, such as savings accounts, NOW accounts, CDs, money market mutual funds, T-bills, and similar very low-risk, highly liquid assets. Generally, clients should not start an investment program to achieve various long-term goals until they feel comfortable with the level of their emergency cash holdings.
How Much Do Clients Need?
Ask five people and you will get five different answers. A popular rule of thumb suggests keeping 6 months’ living expenses (estimated from the family budget) invested in cash-equivalent-type investments. (Note that this amount is closer to 6 months’ take-home pay than to 6 months’ gross salary before taxes and retirement plan contributions are deducted).
Realistically, it might take 4 to 5 years of saving a substantial amount from each paycheck to build up such a fund. The thought of having that amount of money invested in a low-earning cash-equivalent fund, subject to taxes on its meager earnings and inflation on its purchasing power, is not very appealing.
Many families, especially those that have two wage earners with steady employment prospects, can safely reduce the size of their cash reserves to about 3 months’ living expenses.
What Are the Purposes of an Emergency Fund?
The first purpose is to provide liquid assets to cover minor disasters, such as the unexpected demise of a home appliance, postwarranty auto repairs, or the loss of extra income from a part-time job. Anything that presents people with an unanticipated bill or reduction in income requires a source of funds to handle the problem smoothly.
Second, major disasters—the temporary loss of employment for the client or spouse, damage to the client’s home from an uninsured or underinsured loss caused by a flood or earthquake, or uncovered medical expenses—require ready access to funds for living expenses or substantial cash outlays on short notice.
What More Aggressive Approach Can Be Used?
Some people prefer not to keep a substantial emergency fund tied up in cash equivalents. For them, a well-diversified portfolio of mutual funds, both stock and short-term bond, is the investment of choice for most of their emergency funds.
Let’s examine the pros and cons of this approach.
Emergency Funds versus Working Capital. An emergency fund is established to provide for events that are unlikely to happen. If a client is constantly tapping the emergency fund to handle ordinary day-to-day expenses, it is really a source of working capital rather than an emergency fund.
Opportunity Cost. The opportunity cost of keeping money in cash equivalents year after year rather than invested in a portfolio of stock and bond mutual funds is the reduction in after-tax returns earned over the extended period. Earning 3.5 percent after taxes versus 8 percent after taxes amounts to a substantial loss of income.
Inflation. The after-tax return on many cash equivalents fails to keep up with inflation. The real value of the emergency fund may be in a long-run decline, requiring the investor to periodically add funds to keep its purchasing power intact.
Bad Timing. What happens if an emergency requiring a large cash outlay arises at a time when the financial markets are going through a severe correction? The value of emergency fund investments could be hard hit and temporarily insufficient to cover one’s needs; fund shares might have to be sold at the bottom of a bear market.
Borrowing Short-term. To avoid selling stock and bond mutual funds in a bear market, proponents of this strategy recommend temporary borrowing against assets, making unsecured loans, and tapping preestablished credit lines, such as
The amounts borrowed are to be paid back from future income or from the sale of assets when markets recover. Interest expense can be minimized by borrowing first from the lowest-cost loan sources. Recent steep market declines have been for relatively short durations; it is assumed that the length of future market declines will also be short.
Evaluation. This aggressive approach is certainly more risky than the traditional approach requiring an emergency fund invested in safe cash equivalents. The theory behind the aggressive approach is based on certain assumptions, many of which are not always clearly spelled out or clearly understood by its advocates.
The aggressive approach assumes the following:
Are the Potential Returns Worth the Extra Risk?
Suppose that the extra after-tax return on the stock and bond mutual fund portfolios averaged 4.5 percent above the return on a portfolio of cash equivalents and that the average balance in the emergency fund over a 20-year period is $20,000.
Example:
$20,000 invested at 8 percent for 20 years $93,219.14 $20,000 invested at 3.5 percent for 20 years $39,795.78 The added value over 20 years $53,423.36 You would have to borrow large amounts for extended periods to overcome the $53,423.36 potential earnings differential over the 20-year period.
What Should Be Done?
This approach is not for everyone, but it is worth thinking about. Clients with access to sufficient credit sources, especially sources with a low after-tax cost, are in a position to consider the more aggressive approach.
This is not an all-or-nothing proposition; clients with different risk profiles can select different mixes. The most risk-averse clients might be comfortable with the conventional approach—100 percent of the emergency fund invested in ultrasafe cash equivalents, regardless of the relatively low after-tax, after-inflation returns offered by such investments. Other clients with higher risk-tolerance levels might be willing to invest 20 to 80 percent of their emergency funds in a mix of equity funds and intermediate-term bond mutual funds.
The client must determine the relative mix of cash equivalents, intermediate-term bond funds, and equity funds as well as the estimated level of risk inherent in each specific investment chosen. The earnings gap between cash equivalents and the more risky investment alternatives over an extended period must be considered in making the decision.
Is the safety of the conventional approach worth the price? The client must decide.
Where Can I Find Out More?
ATM Cards, Debit Cards, and Credit Cards
Thomas A. Dziadosz
What Was the Situation Before?
Banks issue automated teller machine (ATM) cards that enable customers to make deposits and cash withdrawals "on-line" at ATMs. The cards can also be used at on-line point-of-sale (POS) terminals, typically in supermarkets, to make purchases and receive cash. In both cases, the customer has to supply a personal identification number (PIN) to ensure the legitimacy of the transaction. Withdrawals at ATMs and purchases at on-line POS terminals result in an immediate reduction in the customer’s bank account balance.
The use of ATMs was encouraged as a convenience to customers and a low-cost alternative to a live teller. Typically, there was no charge for using an ATM owned by a customer’s bank, and many banks did not charge for withdrawals made at ATMs owned by other banks in the same network.
What Is the Nature of the Change?
Recently, banks have initiated charges, typically $1 per withdrawal, imposed on their customers who use ATMs owned by other banks. In addition, a fee—often $2—is imposed by the bank owning the ATM. Paying $3 to withdraw funds is difficult to avoid when traveling away from home, and making withdrawals in small amounts has become very expensive. One way to avoid the transaction fee(s) is to make a small purchase at a supermarket with an ATM card and request cash. The maximum amount given in cash varies—some supermarkets set a limit of $50 or $100, whereas others will go as high as allowed by the bank that issued the card.
A more troubling innovation from the client’s point of view is the move by banks to have customers accept a combination ATM/debit card (also referred to as a debit card or check card) in place of their ATM card. These new debit cards are touted in ads as being more "convenient" than the current ATM cards they are replacing, but this is a matter of interpretation.
For example, when using the new card on-line to withdraw funds from an ATM, a customer is still required to supply a PIN. However, the combination ATM/debit card can be used to make purchases "off-line" at retail establishments without supplying the PIN, simply by giving the merchant the debit card and receiving a receipt indicating the amount of the checking account debit. The payment is made either immediately or within several days. No credit is being extended because the funds come directly from the checking account.
Question: What are the advantages of paying for a retail transaction with the new debit card rather than with a credit card—especially one offering a grace period on new purchases?
Answer: None.
How Credit Cards Are Used. Credit cards are used for convenience by about 35 percent of cardholders (meaning they pay their balance in full each month) and as a source of credit by those who carry over an unpaid balance from the previous month.
When purchasing goods with a credit card, the customer’s bank pays the merchant now, and the customer pays the bank several weeks after receiving a statement, or over an extended period if the customer elects to carry a balance.
Credit Cards versus Debit Cards. Those who pay their credit card balance in full each month effectively receive an interest-free loan from the date of purchase until the date the check is cleared. When making a purchase with a debit card, the amount of the purchase is taken directly from the buyer’s checking account. In effect, the interest-free, short-term loan aspect of making convenience purchases with a credit card is lost.
Furthermore, when goods are paid for with a debit card rather than a credit card, the buyer does not have the same rights under consumer credit laws. For example, payment cannot be withheld until a dispute with the merchant is resolved. Since the funds are taken directly from the buyer’s account, any problems must be settled directly with the merchant.
Fraudulent use of a debit card gives the thief direct access to the owner’s checking account as well as any attached credit line. When a debit card is used off-line to pay for merchandise, only a signature identifies the cardholder, and a PIN is not required—the process is similar to presenting a credit card when purchasing goods. The customer, not the bank, is immediately hit with an out-of-pocket loss, and he or she will be in the position of having to convince the bank to replace the stolen funds. Failure to report promptly the fraudulent use of a debit card increases the cardholder’s potential loss exposure. If the cardholder reports the card missing within 2 days after noticing its disappearance, the loss is limited to $50. Waiting longer than 2 days to report the card missing increases the potential liability to $500. And after 60 days, the bank is not obligated to restore any lost funds.
To make matters worse, during the attempt to resolve the fraudulent use problem, any checks written against the funds that the customer thought were in the account will be bouncing all over the place.
What Should Be Done?
It is difficult to find any advantages to paying for merchandise with a debit card rather than with a credit card, especially if the balance is paid in full each month to avoid being charged interest on new purchases. However, even if a balance is carried, many credit cards allow a grace period before charging interest on new purchases.
Those who typically carry an unpaid balance should check the terms of their current credit card to ensure that they are not incurring unnecessary interest changes on new purchases. There are plenty of other credit cards that can be acquired if the terms of the current card are unfavorable.
Generally, an ATM card is preferable to a debit card because the ATM card can only be used on-line by supplying a PIN. The debit card can also be used on-line—PIN required—and off-line without a PIN to pay for retail purchases. It is the off-line use that causes additional risk. Fraudulent off-line use of a lost or stolen debit card or the use of a counterfeit card with the cardholder’s card number allows direct access to the checking account.
Paying for retail purchases with a credit card on which no previous balance is carried is preferable to paying with a debit card. The cardholder gets the float—the interest-free loan—during the grace period and retains all rights under consumer credit laws.
Where Can I Find Out More?
Recent Changes in Credit Card Terms
Thomas A. Dziadosz
Credit card offers are constantly changing. Clients receive a steady stream of mailings from card issuers; some offer lower regular interest rates, while others offer tempting "teaser" interest rates that provide a below-market interest rate for a limited time on transferred balances and, in some cases, on additional borrowing.
Let’s examine some typical offers to compare the terms, avoid hidden surprises, examine fee structures, and find ways to take advantage of the better deals.
How Should Credit Card Offers Be Compared?
Compare the key features of two recent credit card offers from different banks. Each card has no annual fee and encourages the transfer of balances from other credit cards by offering a low introductory interest rate on transfers.
| TABLE 8-2 Summary of Card Transactions |
|||
Transaction |
ATM Card |
Combination ATM/Debit Card |
Credit Card |
Withdraw $100 cash |
|
|
|
| Purchase appliance for $300 |
|
|
|
| Card lost or stolen and used fraudulently |
|
|
|
Card A |
Card B |
|
|
|
|
|
|
Other features, such as a grace period for purchases, transaction fees for cash advances, and the method of computing the balance for purchases (average daily balance, including new purchases) are similar for each card.
Card A offers the lowest teaser rate, 5.9 percent, for the longer period, 1 year; Card B’s rate, 7.9 percent, is good for 6 months. But Card A’s 5.9 percent rate applies only if balances are transferred; otherwise, a rate of 17.65 percent (9.4 percent above the current prime rate) is charged on additional purchases and cash advances. Card B has no such requirement to get the 7.9 percent rate on additional purchases and cash advances.
Why not apply for both cards? Anyone who carries credit card balances and intends to add to them might transfer existing card balances to Card A and add new borrowings to Card B.
What Happens When the Introductory Rate Expires? Card A’s rate rises after 1 year to 17.65 percent (9.4 percent above the prime rate). Card B’s rate rises after 6 months to 11.15 percent (2.9 percent above the prime rate), which is a substantially better long-term rate for existing balances as well as new purchases and cash advances.
What Happens If All Accounts with the Issuing Bank Are Not Kept in Good Standing? Bank A, at its discretion, can immediately raise the rate to 21.15 percent (12.9 percent above the current prime rate). Note that this is a penalty rate—the regular rate on the card is 9.4 percent above prime. Bank B has no such penalty rate in its offer. This could be a real problem with Card A if a payment is received 1 day past its due date or any other accounts at the bank become even temporarily delinquent!
Therefore, beware of offers that allow the bank to unilaterally adjust the card’s current interest rate to a higher penalty rate if any of the cardholder’s accounts with the bank are no longer considered in good standing.
Also, some offers state in the fine print that the issuer can from time to time review the credit report of a cardholder and raise the interest rate without notice if there has been a decline in the individual’s credit rating. The interest rate can be increased even though all accounts are in good standing.
What Should Be Done?
Every time a credit card offer arrives, compare its terms to the terms of credit card(s) currently held. If a large, unpaid balance typically is carried (not a good idea), the entire amount can be refinanced to save a tidy sum on the interest charges. Take advantage of the competition among lenders.
Above all, use the savings to pay down high-interest debt, as shown in the example below.
Example: Assume a consumer has the credit card debts and interest costs shown in the table below.
| TABLE 8-3 Consumer Credit Cost Summary |
|||
Source of Credit |
Average Annual Balance |
Rate |
Annual Interest Cost |
| Visa MasterCard Other national cards Department store credit cards Oil company credit cards |
$1500 $1250 $ 850 $ 500 $ 300 $4400 |
17% 18% 17.5% 21% 18% |
$ 255.00 $ 225.00 $ 148.75 $ 105.00 $ 54.00 $ 787.75 |
If the above balances are transferred from high-interest rate credit cards to a credit card offering a 1-year teaser rate of 5.9 percent, the annual interest cost would drop to $259.60 ($4,400 x 5.9 percent).
The average annual amount of indebtedness, $4,400, is the same. But instead of paying $787.75 in interest charges, the annual interest expense drops to $259.60, a saving of $528.15 ($787.75 – $259.60).
The out-of-pocket savings can be applied, along with other funds from current income, to pay down that expensive credit card debt before the teaser rate expires and the interest rate jumps to a higher level.
Note: Some credit card teaser rate offers apply only to balances transferred from a short list of other credit cards; for example, only balances transferred from Visa, MasterCard, Optima, or Discover cards qualify. One way around this is to pay off nonqualifying balances with a check or cash advance from a source that does qualify, effectively transferring the balance from, say, an oil company credit card or a local department store card to a Visa card. The balance on the Visa card qualifies for transfer to the credit card (another Visa or MasterCard) offering the teaser rate.How Is Credit Card Interest Calculated?
The annual rate of interest charged on credit card balances is not the only factor determining the size of the finance charge. How the finance charges are calculated can make a big difference in the amount you pay. Also, the way new purchases are treated, the timing of new purchases, and the timing of payments can influence the result.
The adjusted balance method of financing calculation typically results in the lowest charge. The finance charge is applied to the amount outstanding at the beginning of the billing cycle minus payments and credits (returns) made during the month.
The average daily balance method (excluding new purchases) applies the finance charge to the amount outstanding each day, divided by the number of days in the month. Notice that new purchases during the month are not included in the amount on which the finance charge is applied. The grace period applies to new purchases even though a balance is carried.
The average daily balance method (including new purchases) calculates the finance charge in essentially the same way, except that new purchases during the month are included in the amount on which the finance charge is applied. Carrying a balance from the previous month eliminates the interest-free grace period on new purchases.
The previous balance method applies the finance charge to the balance outstanding at the beginning of the billing cycle.
The amount paid in finance charges for the month, with the same beginning balance and purchases and credits during the month, is fairly close with all of these methods except average daily balance (including new purchases). This method usually results in a moderately higher finance charge because new purchases during the month are included in the amount on which the finance charge is applied. Most credit cards use one of these four methods when calculating finance charges.
The two-cycle average daily balance method has been around for several years. Recently, more credit card offers have listed the two-cycle average daily balance method (excluding new purchases) or the two-cycle average daily balance method (including new purchases) for computing finance charges. Under these methods, the balance on which the finance charge is based is the sum of the average daily balances for two monthly cycles—the current month and the previous month, with new purchases either excluded or included.
Some credit cards apply the two-cycle method only when the borrower first carries an unpaid balance; then after the second month, the finance charge is calculated using the average daily balance for one month.
Credit card companies must state the method used to calculate finance charges, but they are not required to explain the details. Most people do not understand how a two-cycle average daily balance method actually works. If a credit card ad offers an unusually low regular interest rate, check the method used to calculate the finance charge. The two-cycle method can greatly increase the effective rate of interest and eliminate most or all of the expected savings from the lower advertised rate.
What Should Be Done?
Clients who typically carry a balance should avoid credit cards employing either of the two-cycle average daily balance methods to calculate the balance on which the finance charge applies.
Also, as previously mentioned, credit card issuers may review a cardholder’s credit report periodically to determine if there has been any deterioration in the borrower’s credit rating. This can result in an immediate increase in the finance charge to a punitive level, even though the cardholder’s account balance is in good standing. In states that prohibit creditors from unilaterally changing the terms of the current credit agreement, cardholders will be notified by the card issuer that they have the right to close their account and pay off the balance under the terms of the original contract. Continued use of the card after a certain date means that the cardholder has agreed to accept the changes in the terms of the agreement, including the higher finance charge on the previous balance.
Cardholders who typically carry a balance should look for a card that excludes new purchases when calculating the finance charge. If new purchases are included, the grace period on new purchases is lost in any month that a balance is carried on the card.
Another way around this problem is to have two cards. Carry a balance on the card with the most favorable finance terms and use the second card for new purchases that will be paid in full each month.
Check the fees charged for cash advances, late payments, returned checks, and going over the credit limit.
Using the card for a small cash advance, such as $100, at an ATM may trigger an ATM fee by the bank owning the machine. The credit card agreement can impose additional charges, such as
Late payment fees are anywhere from $10 to $20. Currently, late payment fees are imposed by most issuers on the day after the payment is due. (Several years ago, late payment penalties were not imposed until about 2 weeks after the due date.) Returned check fees are in the $10 to $20 range. Over-the-credit-limit fees can be as high as $20, even if the purchase is preapproved over the phone.
Where Can I Find Out More?
| Top |
Chapter 9 |